Zemanium
Reservoir Explorer SIMULATED / MODEL — reduced-order simulation, not measured plant data

Design

Live readouts MODEL — live estimate

Net power
— MW
Cost of electricity
$—/MWh
Production temperature
— °C
Pumping
— MW
Capital
$—M

Baseline vs the design

Audited numbers of record — the system study's modern reference against the complete-system target case. AUDITED qa/thirty-mwh-audit-2026-09-14

SPEC — what would have to become true

Full stack at 320 °C (all five inventions land): —/MWh, — MW average net.

MODEL-vs-MODEL cross-check

Independent check against NREL's GEOPHIRES-X simulator.
How the numbers are made

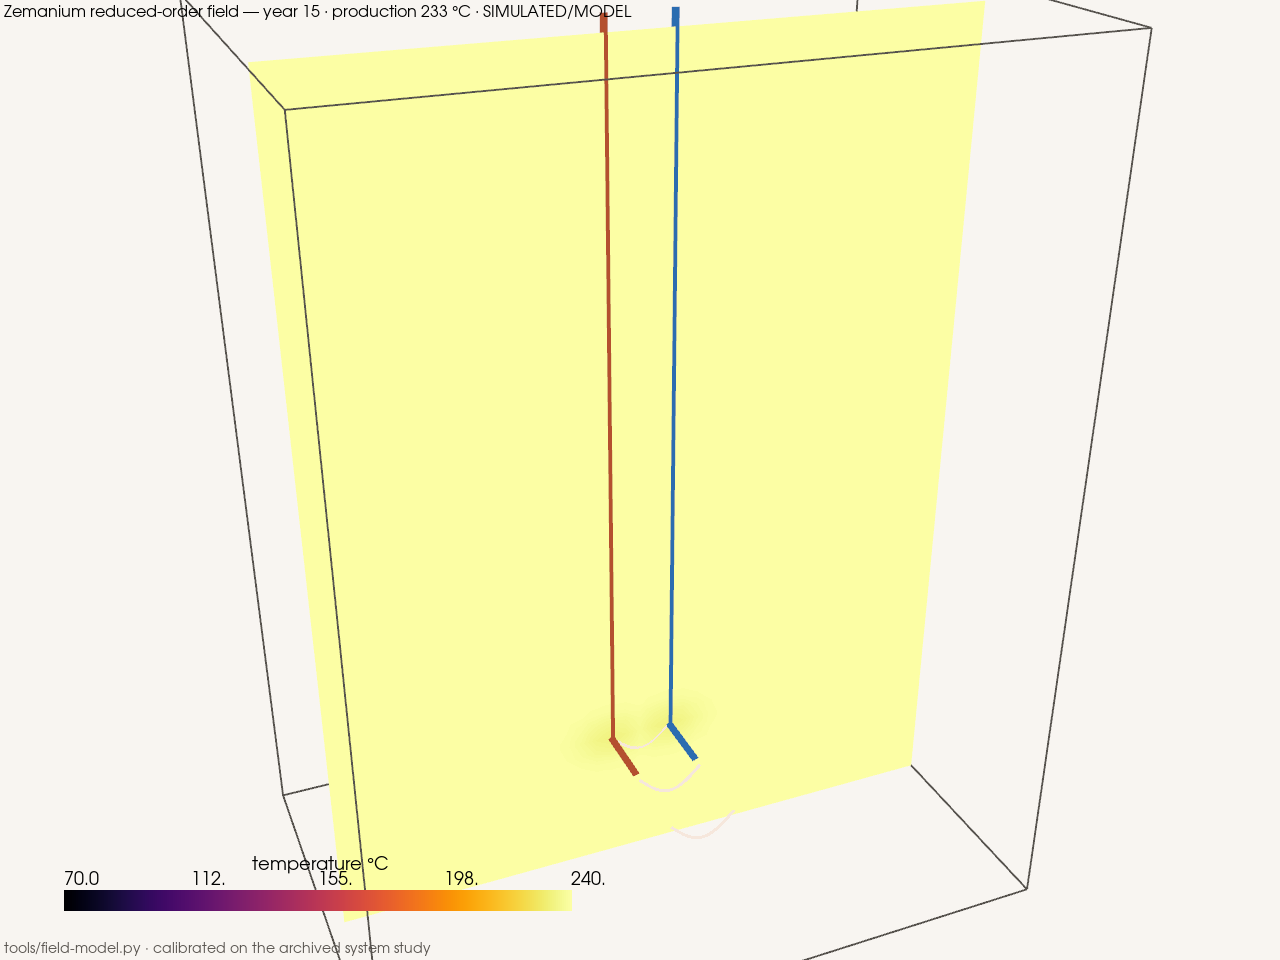
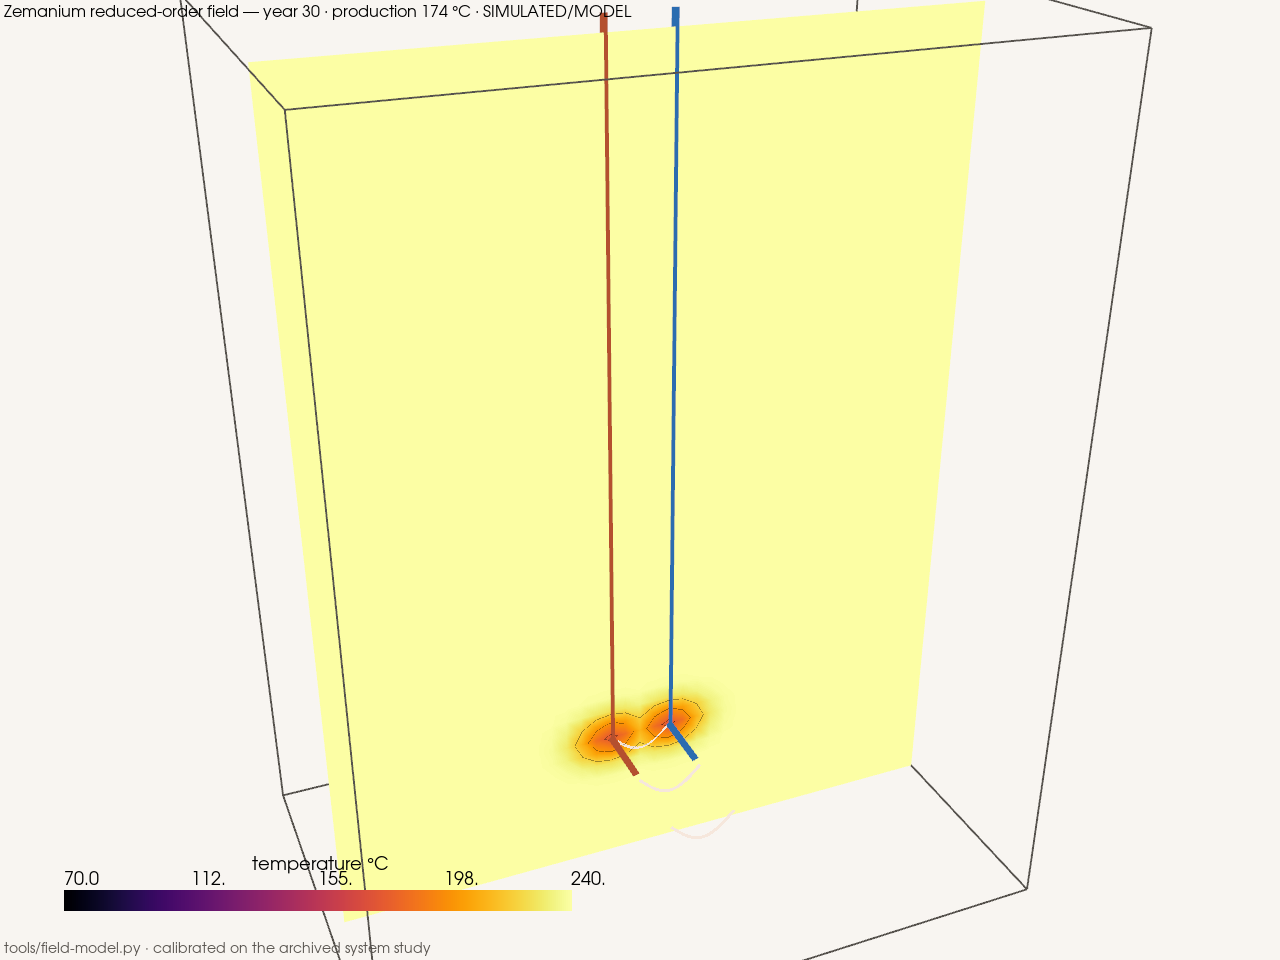
Cinematic view. The cutaway reveals, the wells descend, the field evolves over thirty years — rendered from this same model and scene, not an artist's guess. SIMULATED

One model, two runtimes

The economics come from the audited ladder model (tools/audit-thirty-mwh.py) applied to a reduced-order thermal-front trajectory calibrated against all three archived system-study runs (joint fit, ≤ 4 °C gate, tools/test_field_model.py). The browser runs the same equations; a parity test proves the two agree to 1e-9 (src/fieldDemoParity.test.ts).

What is measured

Nothing on this page is measured plant performance. The anchors are audited model rows; live readouts are labelled MODEL estimates; the 3D field is a rendering consistent with the model trajectory. Hardware confirms these predictions later — it does not gate our ability to have them.

Independent cross-check

The same spec row was run through NREL's GEOPHIRES-X simulator with declared assumption inputs. The audited row lands inside the external envelope; completion hydraulics is the swing term (qa/geophires-crosscheck-2026-10-02.json).

Scientific view

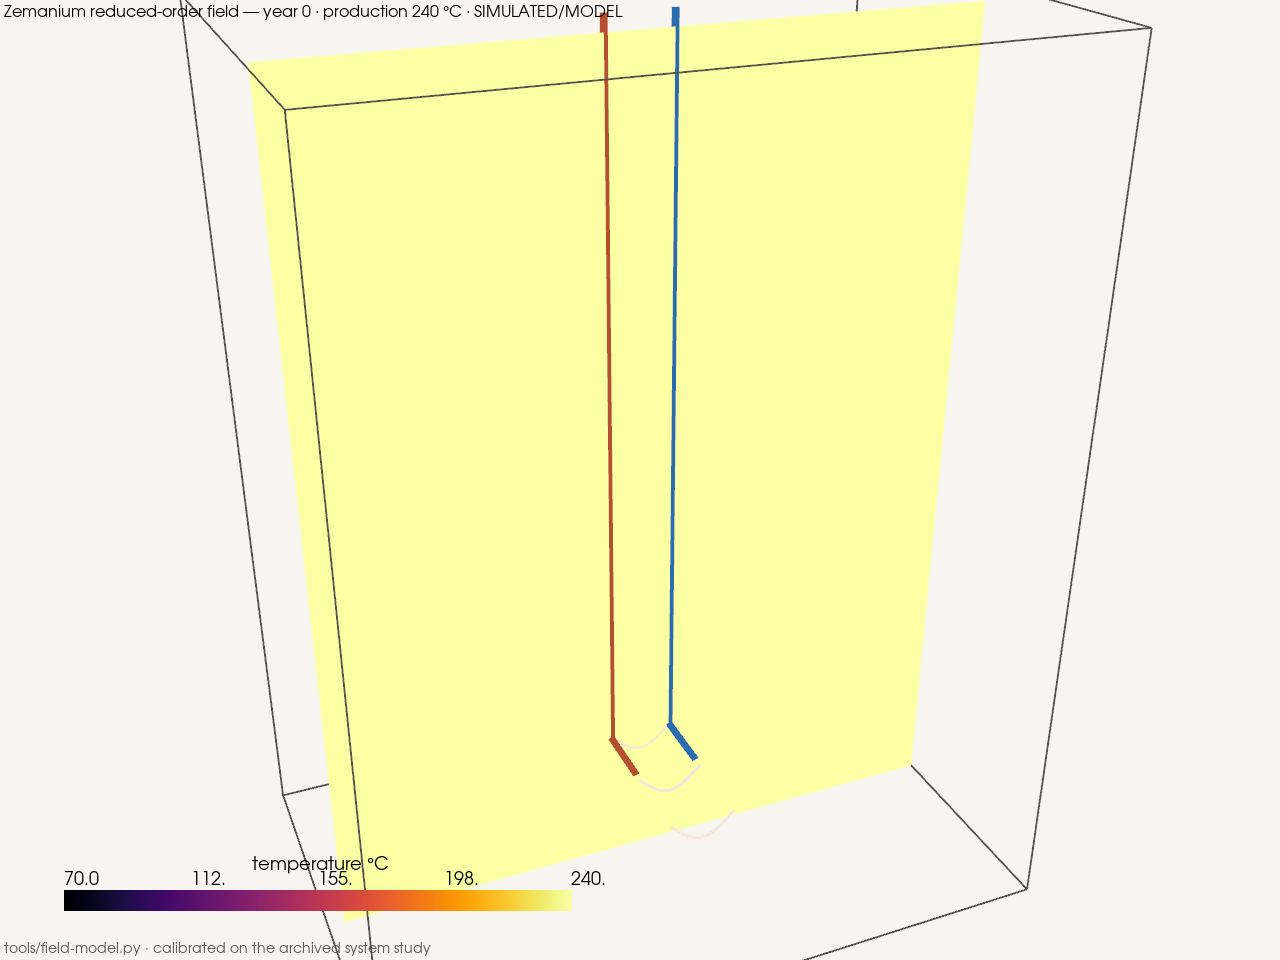
Temperature field, year 0 Temperature field, year 15 Temperature field, year 30

Mesh, temperature contours and streamlines from the same model — the credible view for engineers.